

On 25 July 2017, Mindtree’s quarterly shareholder letter reported the best quarter so far for digital contract closures, at $108 million. “This demonstrates our leadership in Digital,” the company said, and this ‘leadership’ was allowing Mindtree to compete successfully for large opportunities.
Mindtree had already simplified the name of its digital revenue category. For the March 2017 quarter, it reported Digital revenue share at 39.6%, while the category was defined as: includes Social Media, Mobility, Analytics, Cloud, Web-commerce.
A year earlier, in the March 2016 quarter, the company had called the category Digital/SMAC and reported its revenue share at 38.6%. The definition was unchanged: includes Social Media, Mobility, Analytics, Cloud, Web-commerce.
The published definition did not change. Mindtree renamed the category from Digital/SMAC to Digital while keeping the same five components, word for word. Its filings do not show whether it also changed how individual contracts were classified within that definition.
That small change illustrates the wider problem with the data. Between 2015 and 2023, companies across 11 present-day IT services lineages published revenue categories designed to show their relevance to the shift towards cloud-era services: Accenture, Cognizant, Coforge, HCLTech, Infosys, LTM, Mphasis, Persistent Systems, Tata Consultancy Services, Tech Mahindra and Wipro. For this count, Mindtree and LTI are treated as predecessors within the present-day LTM lineage, although their historical metrics remain separate series. Each company defined its own category, so the figures cannot be compared on equal terms.
Every series examined here was eventually discontinued. Some were dropped while the reported category was still growing. TCS was the only company to explain why in January 2020 when it explained that the digital/non-digital boundary had become too nebulous and non-value-adding to continue reporting it in quarterly results. The filings reviewed for the other companies contained no comparable public explanation.
This whole rigmarole is in its nascency when it comes to reporting ‘AI revenue’ or clients.
Four Indian IT services companies I examined for this blog now report AI revenue explicitly. HCLTech was the first to do so in its October 2025 results. TCS and Infosys followed suit, and LTM started reporting it from its Q1FY27 results. The four measures cover different sets of work. HCLTech counts a narrower subset of Advanced AI services, while LTM excludes Enterprise AI because it is pervasive across its iRun and iTransform services. Accenture’s Q1 FY2026 results were the last in the filings examined for this blog that included an Advanced AI revenue figure. The Q2FY2026 results omitted it (Accenture's fiscal year runs from September 1 to August 31).
This piece tries to examine what the disclosures can support by using the cloud transition as the base, and using nearly four years of the AI transition to help you understand how to look at the coming earnings season and the disclosures that an investor in these companies will have to consume. Most of these companies changed both the language they used and the work included in their reported categories while the cloud transition was in play. I believe this will again happen as we sink deeper into this AI transition and assess its impact on Indian IT services companies.
That finding is limited to the companies’ public disclosures. The measures cannot isolate the effects of pricing, wages, geography, utilisation, subcontracting, acquisitions, exchange rates or changes in service mix. They therefore cannot help persuade that the underlying economics was unchanged.
In Part V I try to deal with the main complication, and this is where you will find the most interesting piece of insight that I found in this entire exercise. Don’t run there yet. Stay, and read on.
I. How to write an epitaph of an industry
The diagnosis is older than the epitaph.
In July 1990, Michael Hammer argued in the Harvard Business Review that companies had invested heavily in information technology and seen disappointing results because they used it to mechanise existing processes rather than redesign them. Ford’s accounts payable operation then employed more than 500 people. Conventional automation was expected to bring that number down to about 400. Mazda handled comparable work with five. Ford eventually redesigned the process and cut its accounts payable headcount by 75%.1
Hammer also described an insurance application that took 22 days to process, even though the work itself amounted to just 17 minutes. Doubling the speed of that work would have saved 8.5 minutes from the 22-day cycle. His conclusion later became a management cliché: don’t automate, obliterate.
Hammer and James Champy later estimated that 50%-70% of organisations attempting this kind of redesign fell short of their intended results. They called the estimate unscientific. It reflected their experience of how difficult transformation could be, without a systematic measurement of failure rates.2
Indian IT has been written off before, with a deadline attached.
In February 2012, Forrester published a note asking whether India’s IT services success story was coming to an end. It predicted that the industry would shift from human capital to software capital within five years. Labour arbitrage, it argued, was losing traction as a value proposition, and the sector would create far fewer jobs than it had in the past.3
In July 2017, Forrester returned to the subject. In this note, it said that the Indian media were busy sounding the death knell for what was then a $150 billion industry, adding that doom generated page views. It then offered a forecast of its own. Roughly 60% of the average offshore firm’s revenue came from annuity streams such as infrastructure management, application maintenance and BPO. Forrester expected automation, cloud and SaaS to erode that base by up to 40%.4
NASSCOM put Indian IT industry’s revenue at $167 billion in FY2018 and in FY2026 put the estimated revenues at around $315 billion for FY2026. The industry body also estimated direct employment at nearly 6 million in FY2026, up from roughly 1.6 million in FY2007. (The employment and revenue comparisons cover different periods.) The revenue figures may also not be strictly comparable because the later estimates use broader industry coverage.5
The endpoints support a limited conclusion. At the sector level, the revenue and employment figures cited above show no collapse of the kind predicted in contemporary death-knell commentary.
The 2012 note’s concern that growth would become less tightly tied to additional labour resembles the flattening of revenue per employee across the companies I have analysed for this blog. The data does not help conclude that a single ‘linear model’ ended or confirm the note’s explanation for the change, but merely indicates that the cloud-era bears identified a genuine pressure, while misjudging its timing, scale and the industry’s ability to absorb it.
The industry made forecasts of its own, and they fared worse.
During Wipro’s Q4FY2016 earnings call on 20 April 2016,Abidali Neemuchwala, just about 80 days into the chief executive role, presented his strategy for the first time. The company would double revenue to $15 billion by FY2020 at a 23% operating margin, and six themes would get it there. Neemuchwala said each theme had measurable performance markers that he would report against periodically.6
The fifth theme was hyper-automation, described as changing not only delivery productivity but the way work is done, drawing on cognitive and robotic process automation, and drastically changing the traditional IT delivery model. Wipro had run proof of concepts across 42 clients.
Neemuchwala’s fourth theme was non-linearity. It centred on HOLMES, a platform described as providing augmented or artificial intelligence and cognitive capabilities. Wipro reported 18 client engagements and six new pilots during the quarter. It had also filed 24 patents related to the platform in three months, part of 514 patent applications filed across nine jurisdictions that year.
By April 2016, Wipro was reporting a named AI platform with client engagements, industrial use cases and its own patent portfolio.
II. He said, she said
The standard account of the early 2010s casts Indian IT as an industry defending itself against cloud computing. The earnings transcripts show a different chronology.
In TCS’ calls, digital dominated the language of the next transition through the mid-to-late 2010s. Cloud appeared in the discussion as one part of a broader transformation. Only around 2019–2021 did cloud-specific language become comparably prominent, as hyperscaler partnerships moved towards the centre of TCS’s disclosures.
The word cloud does not appear once in Wipro’s six-theme strategy presentation from April 2016.
At Mphasis, cloud appeared only sporadically in earnings calls through most of FY2017. It became part of the company’s regular vocabulary towards the end of that year and through FY2018, after the earlier panic had passed.
Mphasis was not alone. TCS, HCLTech and Coforge were still discussing cloud in their disclosures during FY2020 and FY2021, nearly a decade after Forrester asked whether India’s IT services success story was ending.
Outside the industry, cloud dominated the story about Indian IT long before it dominated the companies’ own stories about their businesses. When cloud eventually arrived as a substantial business line, management described it as a source of demand.
The response from TCS illustrates this clearly. On 18 July 2013, an analyst noted that SAP, Oracle and other vendors were reporting a higher cloud component in licence sales. He asked N. Chandrasekaran whether TCS was seeing an impact on its ERP or application maintenance business.
Chandrasekaran said the impact was not significant. He expected TCS to gain even from cloud-based solutions because the platform companies would need services partners to implement and deploy them. His confidence rested on the platform owner still needing a services channel. That logic returns in Part V.
Fifteen months later, on 16 October 2014, an analyst asked Chandrasekaran how to interpret the size of the digital opportunity he had been describing. His answer exposed a problem with the category.
Application maintenance work that was being replaced or rationalised was moving into Digital. Infrastructure contracts arrived as managed services with a transformation component that moved them to cloud. Commoditised applications, when transitioned, moved to cloud-based platforms. All three counted towards Digital. Chandrasekaran said TCS needed to separate genuinely new business entering Digital from existing work in the current model that would eventually retire to cloud. The split was necessary, he said, and very difficult to make.7
Eighteen months later, TCS disclosed $2.3 billion in digital revenue as a single figure. It did not provide the breakdown Chandrasekaran had discussed, and that level of detail never appeared in the disclosure record reviewed for this article. Nine months before the October 2014 admission, an analyst had asked Chandrasekaran directly about cannibalisation. He rejected the premise and said TCS viewed the change as transformation and had never encountered a case in which one thing simply replaced another.
One day after that January 2014 call, T.K. Kurien presented Wipro’s Q3FY2014 results where he described ServiceNXT as a proprietary platform spanning application management, infrastructure management, cloud and security. It combined machine learning with hyper-automation. Two clients signed during the quarter were seeing savings of up to 40%, beyond those achieved through labour arbitrage.
When asked about a sequential decline in headcount, Kurien attributed it to productivity and a changing workforce mix. Wipro would need more customer-facing staff, architects and integrators, and fewer people doing routine coding at the back end. The traditional delivery pyramid, he said, was beginning to resemble an hourglass.
That was January 2014.
In July 2026, Tech Mahindra attributed its 7% year-on-year decline in IT services headcount to productivity gains from new AI tools on fixed-price engagements. Twelve years apart, both companies gave the same basic explanation for a smaller delivery workforce: higher productivity. Only the later account tied it explicitly to AI tooling.8
One exchange captures what was happening succinctly. On two consecutive days in January 2014, the same analyst asked TCS and Wipro whether artificial intelligence would spread beyond robotics.
TCS’ Chandrasekaran said AI and robotics would become very important to the broader digital story, although these were still early days. On Wipro’s call the following day, Kurien asked to return to the question at the end if time allowed. The call ended without an answer.
The broader tension between continuity and transformation also appeared in the succession planning underway at Infosys in the mid-2010s after Vishal Sikka left the company. When it announced Salil Parekh as CEO-designate in December 2017, ahead of his taking charge on 1 January 2018, Nandan Nilekani said Parekh would “fit into our culture and, at the same time, bring about the required transformation.”
In July 2026, Infosys presented institutional continuity as the basis for navigating another technological shift when it announced Ashiss Kumar Dash as CEO-designate. Eight years later, Nilekani again cast succession as a way to preserve the company while changing it.
III. The Houdini Act
Between 2015 and 2018, the 11 corporate lineages in this study reported revenue categories designed to show how much of their business was tied to the technology transition then under way. Each company used its own name and definition. Every category was later discontinued.
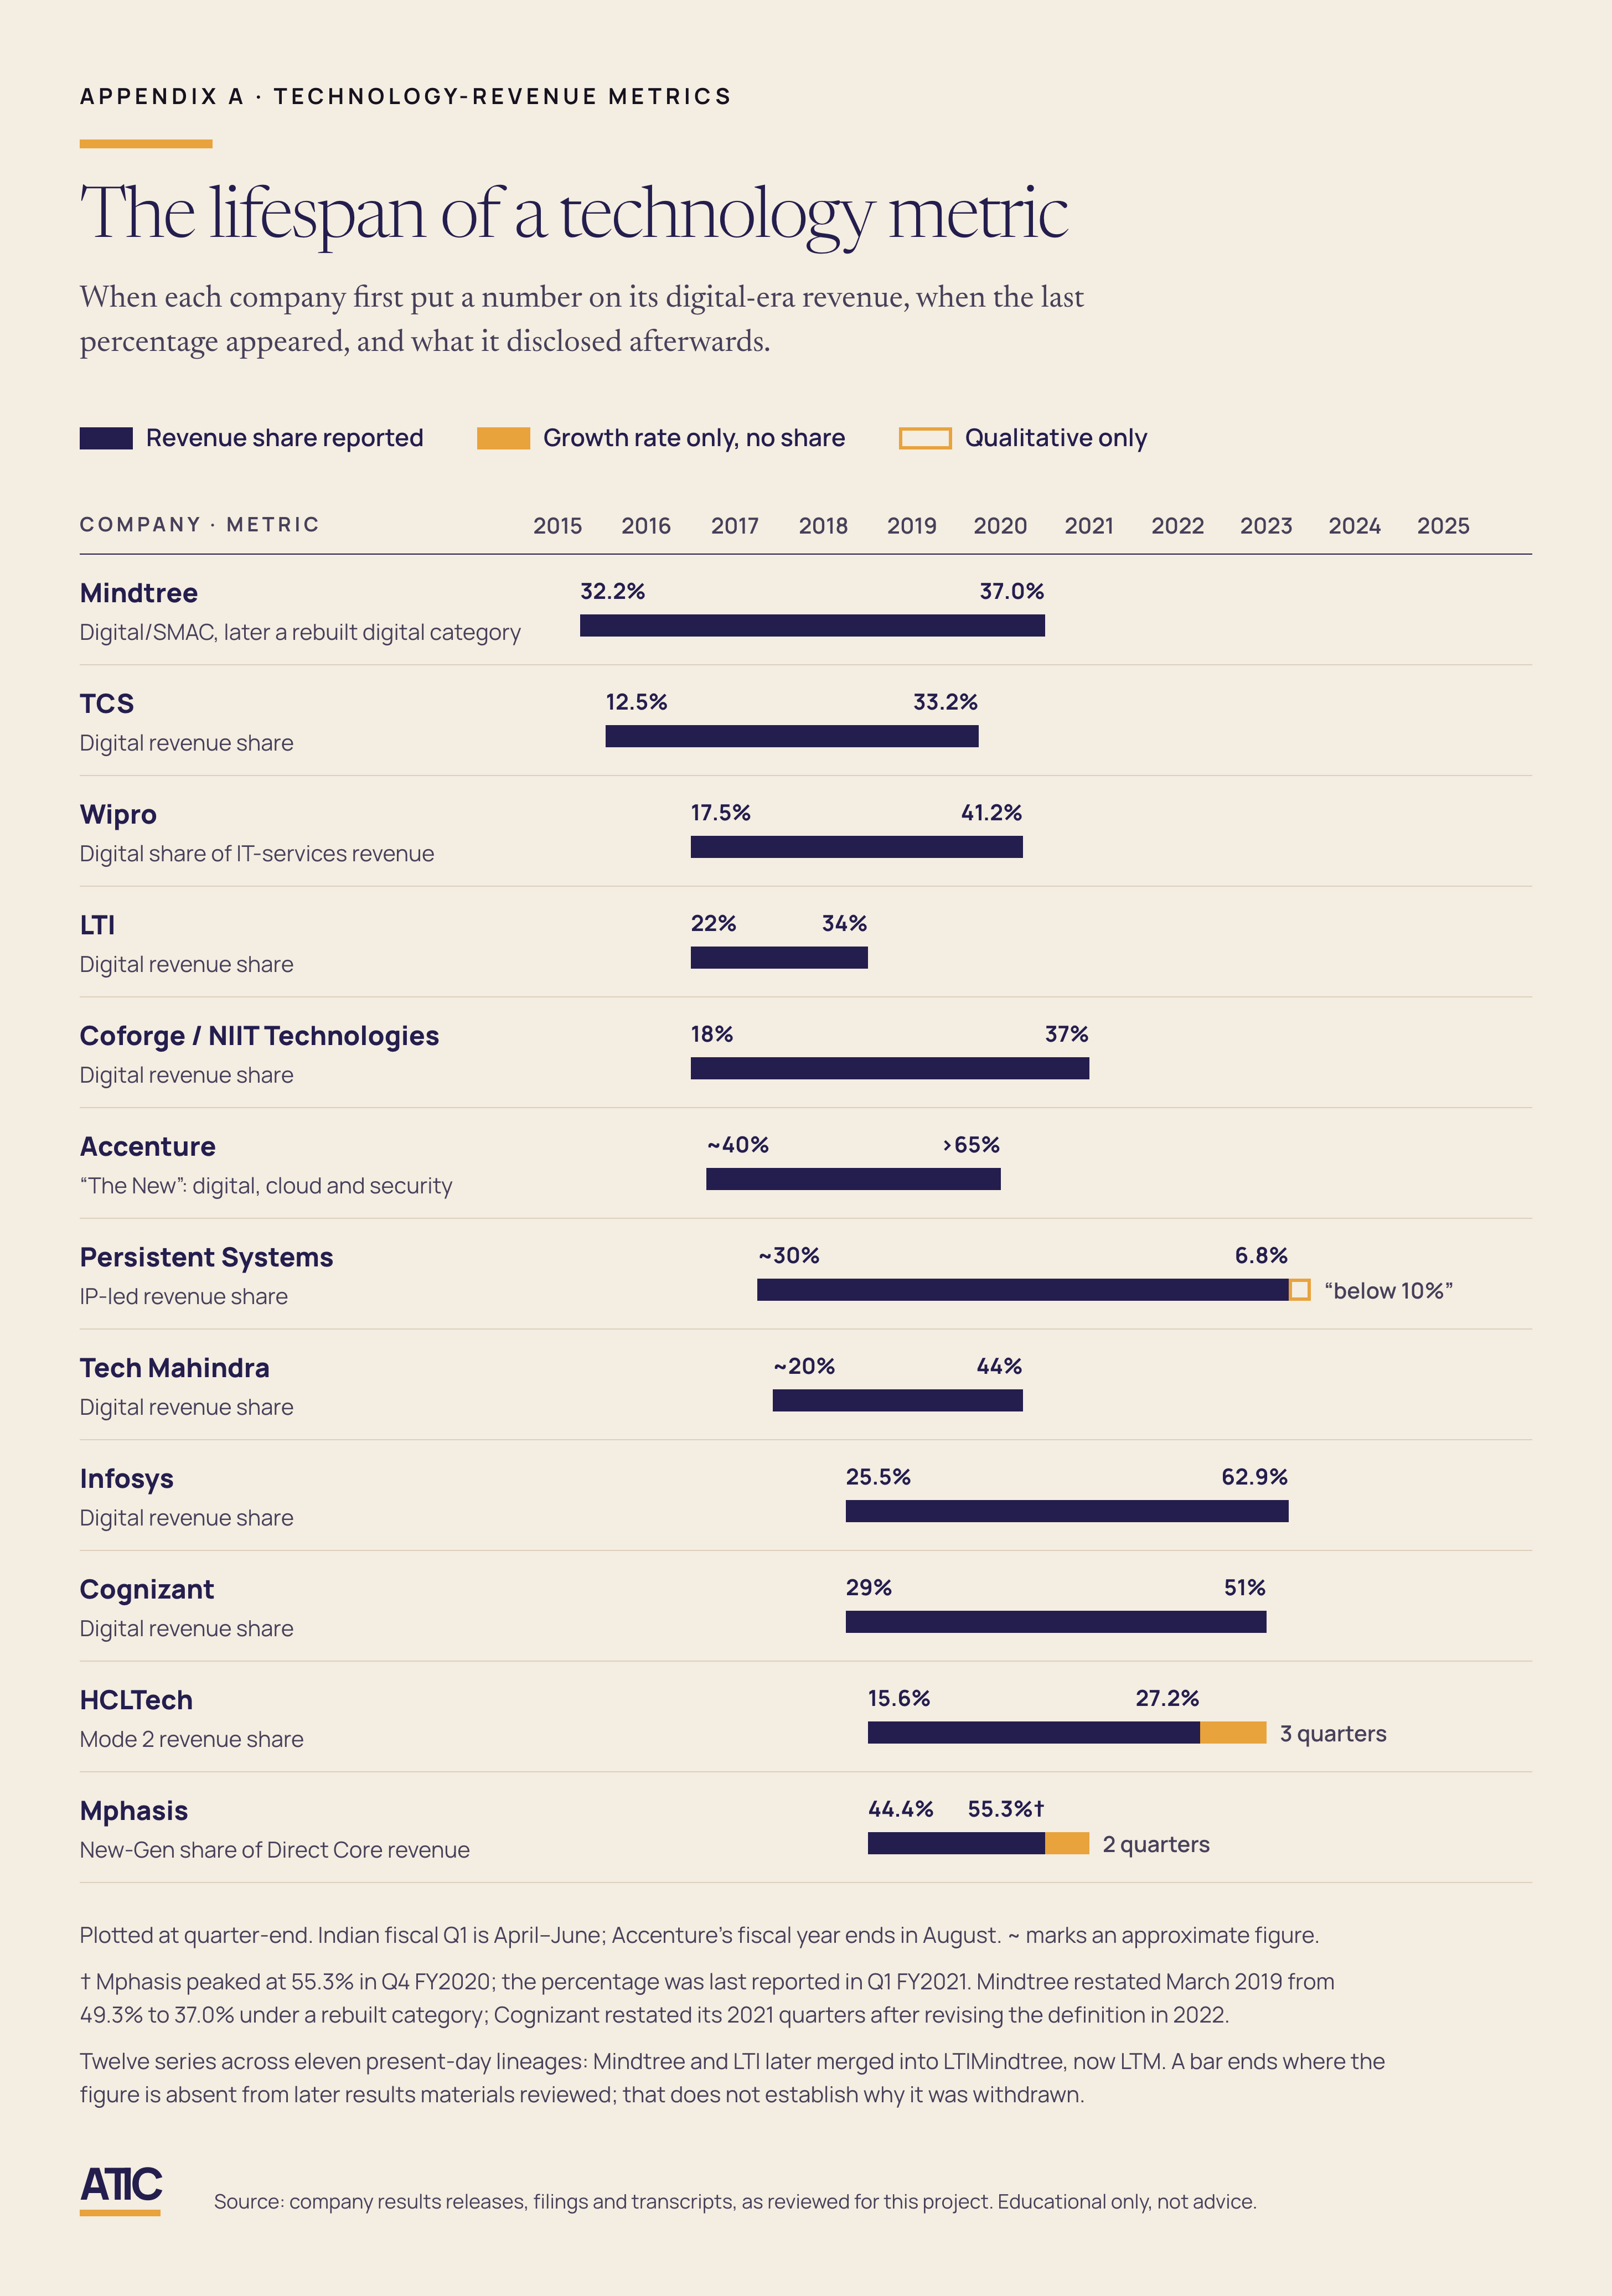
TCS first quantified digital revenue on its earnings call on 9 July 2015 when it accounted for 12.5% of quarterly revenue. The figure appeared in its results materials for 18 consecutive quarters, rising to 33.2% in Q2FY2020. It disappeared from the next quarterly report (Q3FY2020), and did not return in the filings reviewed till Q1FY2027. Digital revenue was still growing in its final reported quarter, up 27.9% year-on-year.
Infosys began reporting its digital metric in April 2018 at 25.5% of revenue. The series ran for 21 quarters and reached 62.9% before its final publication on 13 April 2023 (Q4FY2023 results). By then, the category covered nearly two-thirds of the business, limiting its usefulness as a distinguishing label.9
Wipro first reported the metric at 17.5% in the June 2016 quarter and last reported it at 41.2% in quarter ended 31 March 2020. The preceding quarter’s disclosed year-on-year growth rate was 22.8%.
Tech Mahindra described the share as “north of 20%” in its Q4FY2017 results announcement and “close to 27%” a year later. Its final figure was 44% in the quarter ended 31 March 2020. In the same release, sequential growth had slowed to 2.0%, from 10.6% in the preceding quarter.
LTI’s series began at about 20% and ended at 34% in June 2018, following a year in which the category had grown by 42%. Coforge reported the metric for 19 quarters, during which its share rose from 18% to 37%. Its previously published year-on-year growth rates had varied widely, but the final disclosure reported only the category’s share.10
HCLTech reported a category called Mode 2, which covered digital and analytics, IoT, cloud-native services and cybersecurity. It last published the category’s share of revenue in the results for the quarter ended 31 March 2022, at 27.2%. HCLTech then reported growth rates for three more quarters before discontinuing the category.
Mphasis called its category New-Gen Services which accounted for 44.4% of Direct Core revenue in Q1FY2019 and reached 55.3% by Q4FY2020. Mphasis stopped publishing the percentage after Q1FY2021, although it continued reporting growth rates for another two quarters and then retired the revenue measure. By that point, “New-Gen” covered more than half of the relevant business and had become less useful as a distinction.11
Cognizant reported digital’s share of revenue from the first quarter of 2018 (financial year follows the calendar year), when it stood at 29%, through the final quarter of 2022, when it reached 51%. After revising the category’s definition in 2022, the company restated the four quarters of 2021 at 46%, 47%, 49% and 49%. By the final disclosure, year-on-year digital revenue growth had slowed to 4%. The category did not appear in the subsequent filings that I reviewed for this blog.12
Accenture reported a category called ‘New’, which comprised digital, cloud and security. Its share rose from approximately 40% of revenue in FY2016 to more than 65% in Q1 FY2020 (Accenture's fiscal year runs from September 1 to August 31). In mid-2019, an analyst noted on an earnings call that the metric had remained above 60% for four quarters, following seven consecutive quarters of increases. This analyst cited Accenture’s published figures, and management did not dispute the reading. The category was retired soon afterwards.
Persistent Systems reported IP-led revenue alongside what it explicitly called linear revenue. IP-led revenue reached roughly 30% of total revenue in FY2017. Across five quarters between FY2019 and FY2023, the company disclosed sequential declines of 15.4%, 24.3%, 2.9%, 26% and 12.8%.
The disclosure gradually narrowed. An exact revenue share gave way to a range and a growth rate before the split was discontinued. The last exact quarterly share in the reviewed filings was 6.8% in Q4FY2023. In Q1FY2024, management put the share between 7% and 9%, reported 8% sequential growth in IP revenue and said it would stop publishing the split.
The split disappeared in some companies’ earnings announcements while the reported category was still growing. Others ended it after growth had slowed or after the category had expanded to cover majority of their businesses. The timing varied, but the disclosure practice was consistent: each company could withdraw its chosen measure without saying what had replaced it. TCS explained why its boundary had lost its usefulness, yet it identified no replacement metric.
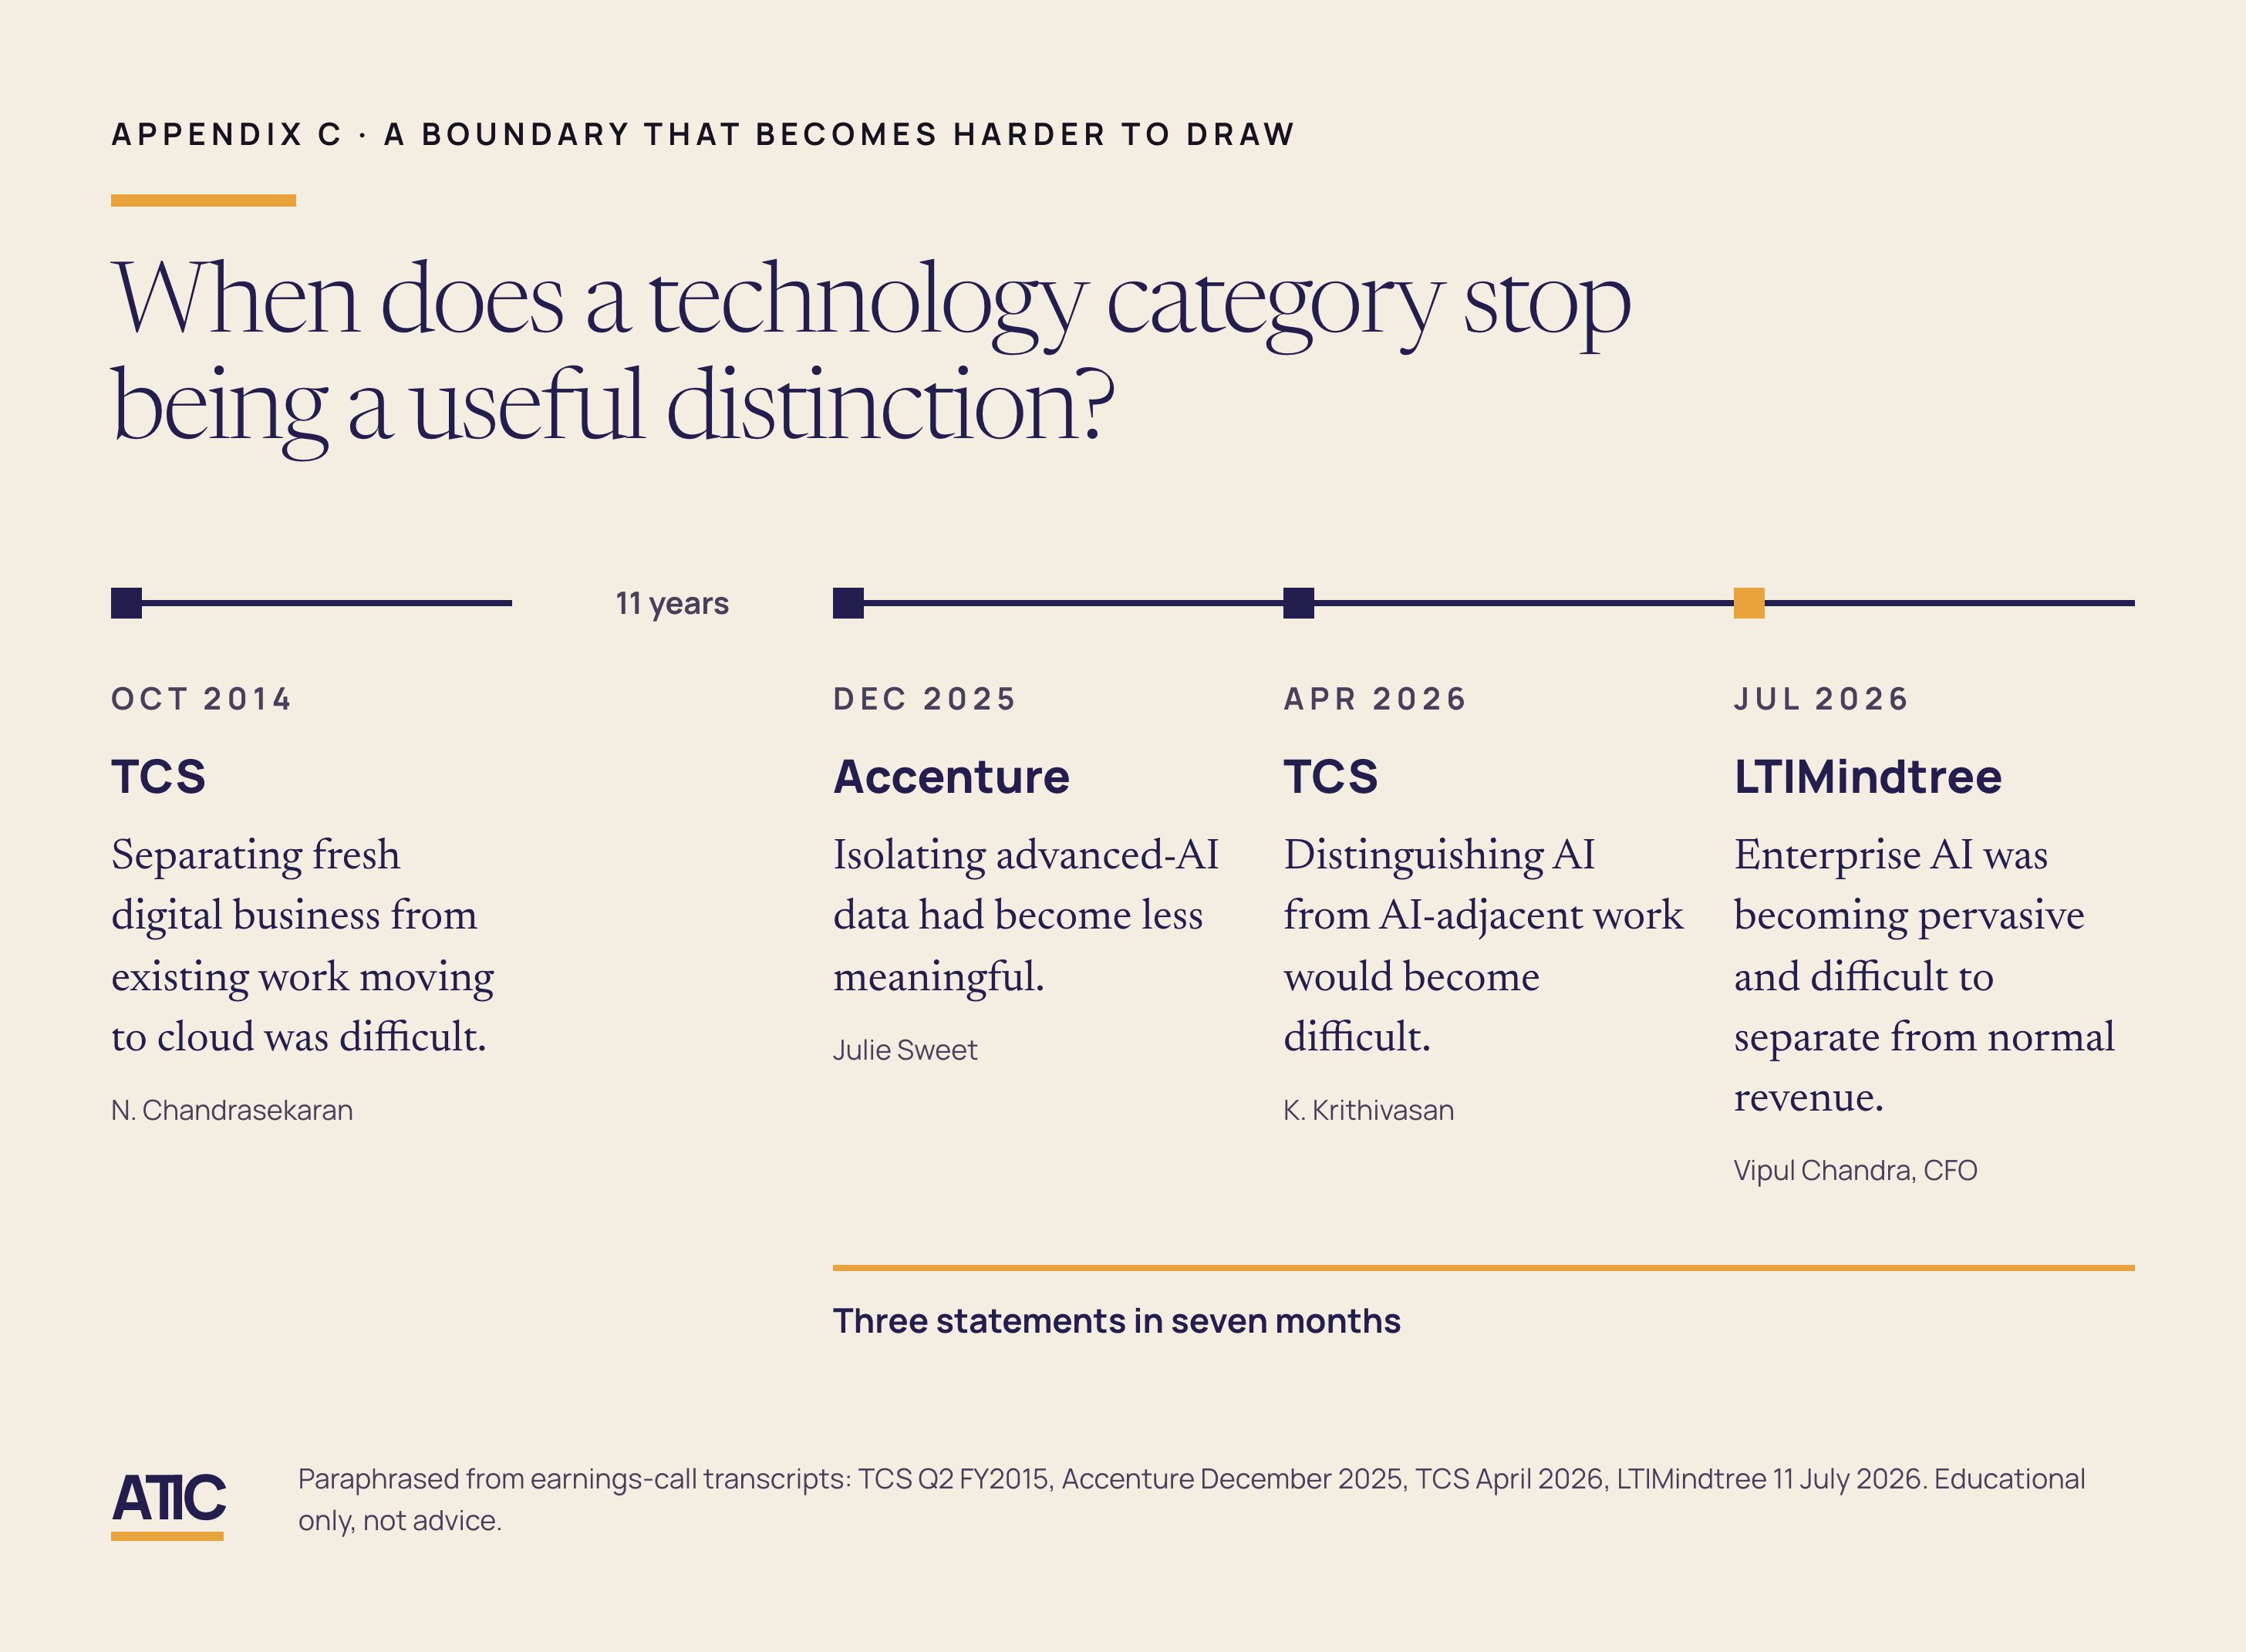
There is a second pattern inside the first, and it is sharper.
TCS stopped publishing utilisation excluding trainees after the December 2015 quarter. By then, it was already reporting digital revenue, which stood at 13.7%. The older metric disappeared as the newer one gained prominence, although the timing alone cannot help us conclude that one replaced the other.
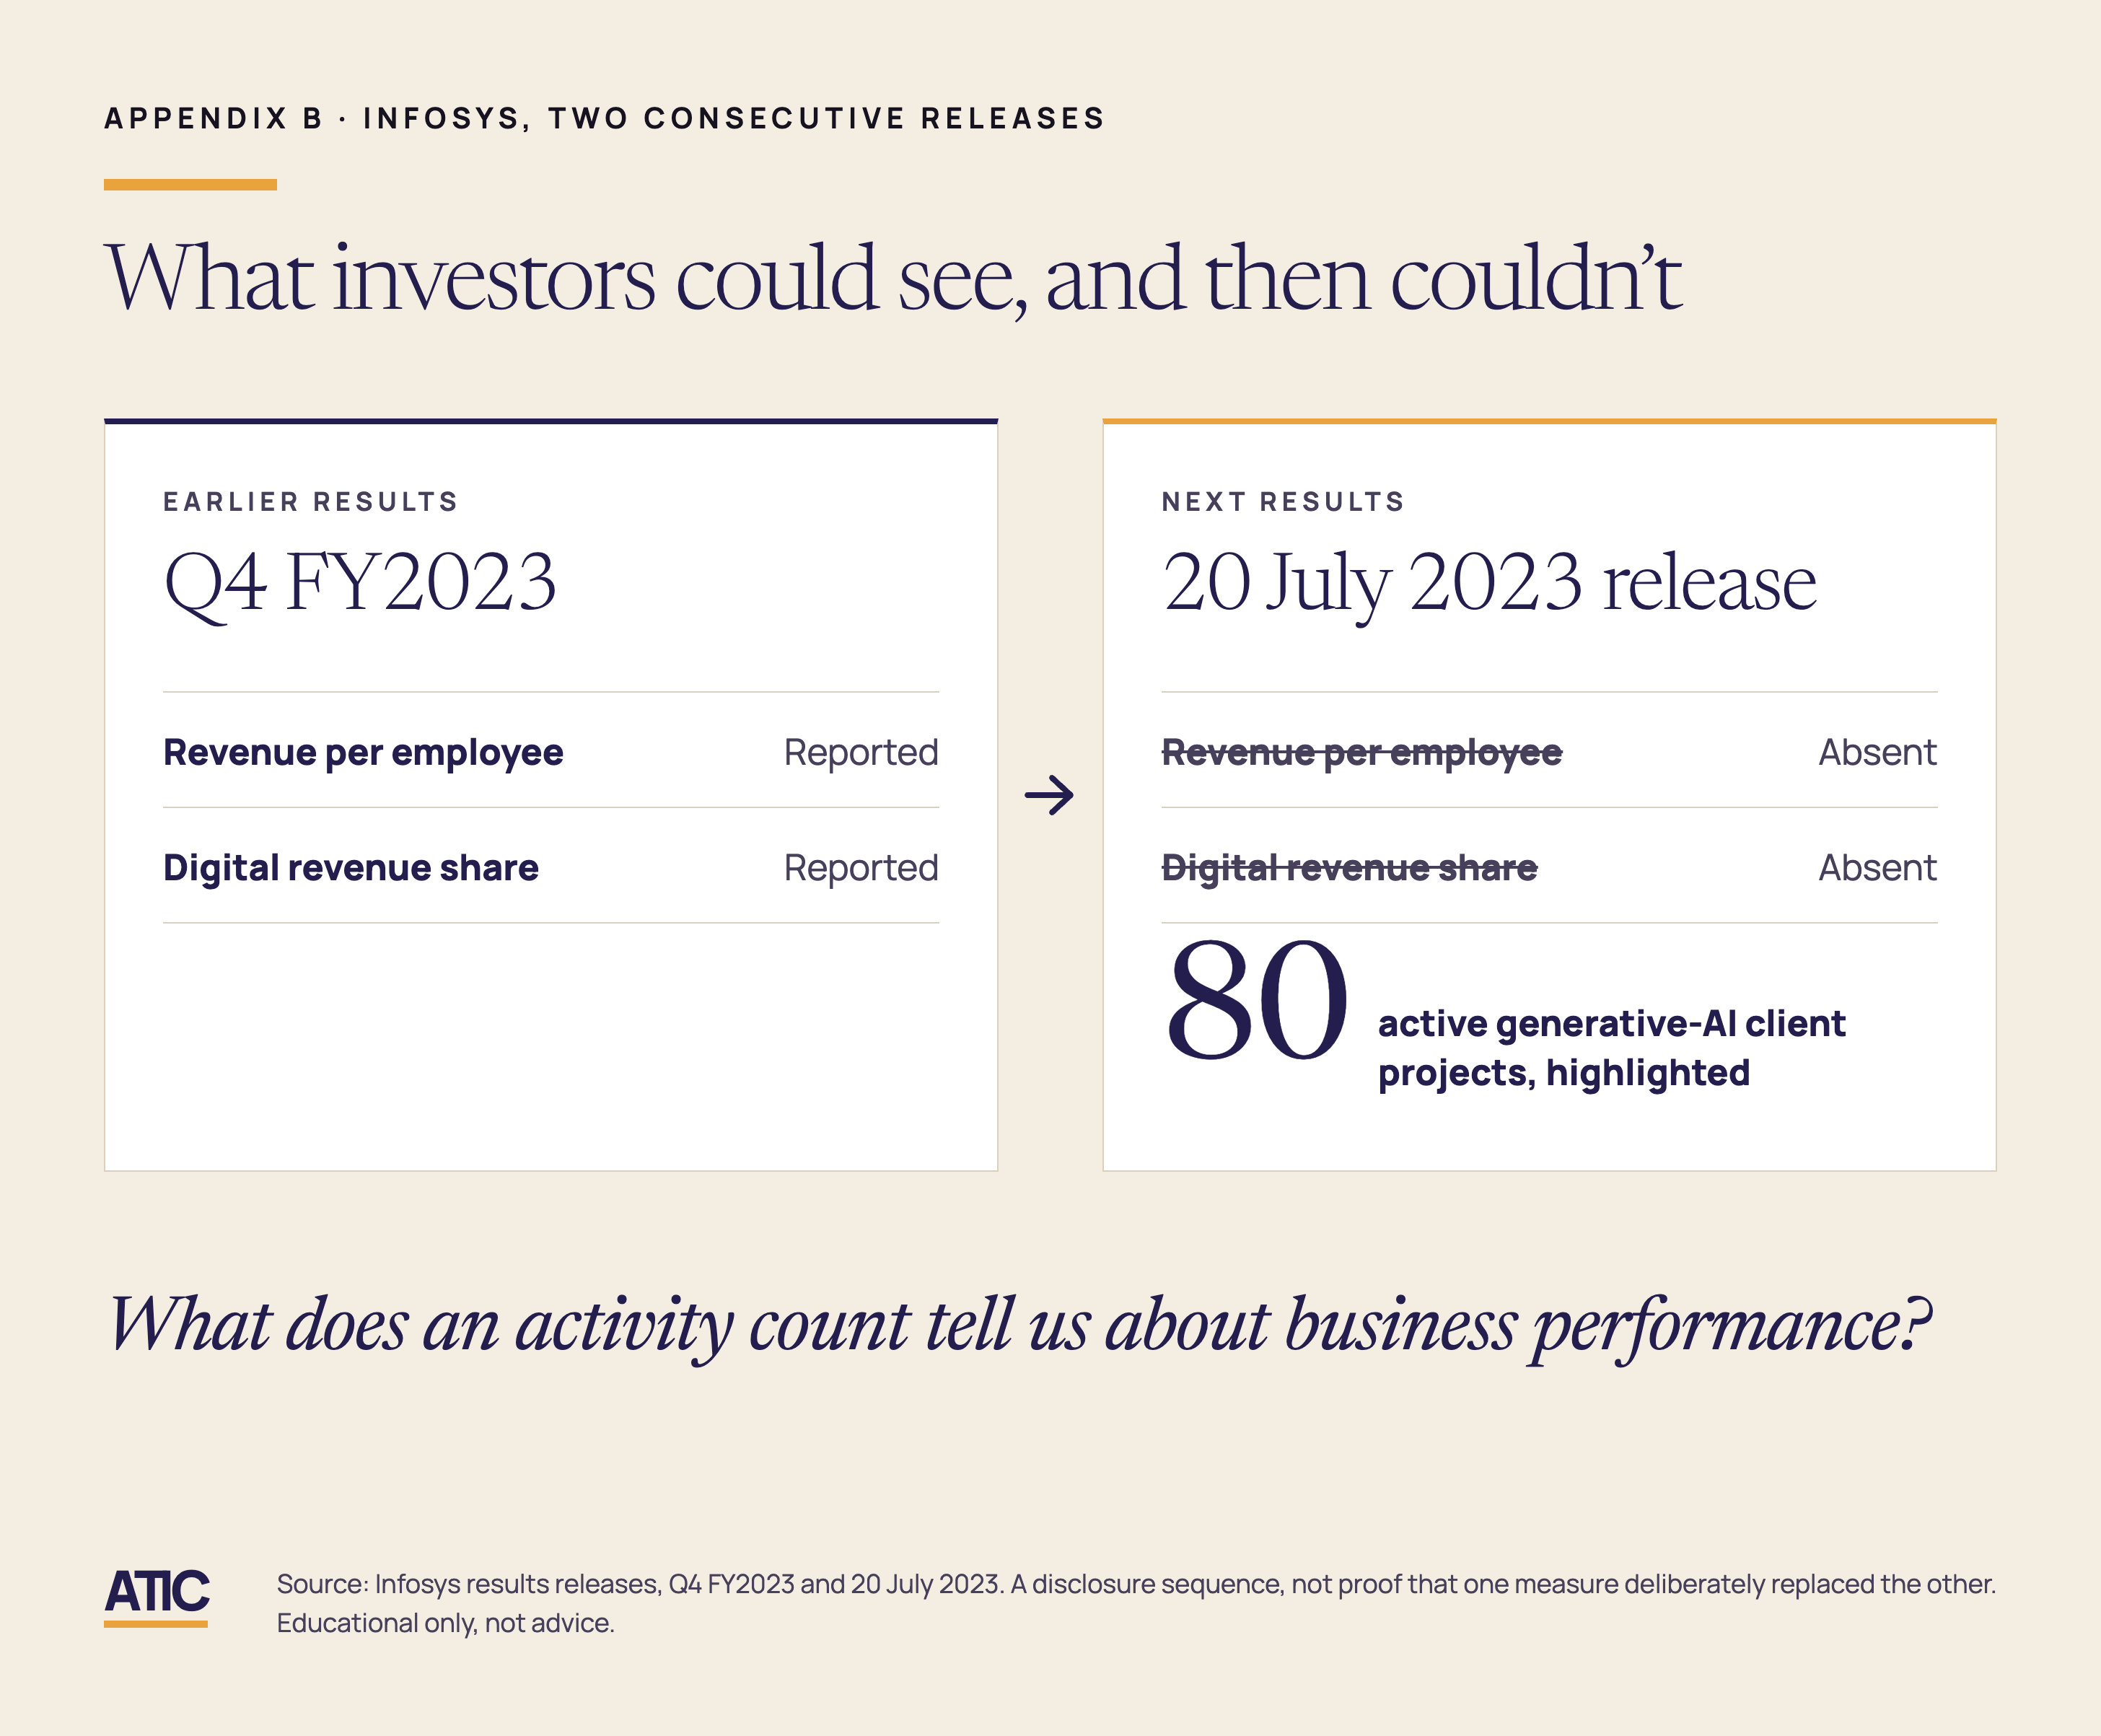
Infosys last reported both revenue per employee and digital’s share of total revenue in its Q4FY2023 results. The next quarterly report, released on 20 July 2023, omitted both measures and highlighted 80 active generative-AI client projects. Infosys did not present this as a substitution. The disclosure record nevertheless shifted from two frequently used performance measures to a count of projects under way.
When Persistent stopped publishing IP-led revenue in FY2024, its results filings were giving increasing prominence to AI. The disclosure emphasis had shifted, but the reason for that shift was not stated.
TCS stopped reporting its fixed-price and time-and-materials contract mix after the March 2015 quarter. Infosys withdrew the same measure after March 2019. It had published the mix for 28 consecutive quarters, during which the fixed-price share rose to 53.3% from 38.0%.
Measures such as utilisation, revenue per employee, contract mix and non-linear revenue allowed outsiders to see how the business was delivered. Several were later withdrawn. In some cases, the surrounding disclosures gave increasing prominence to self-defined revenue categories or activity counts. It’s not that it’s a deliberate substitution but it does show that investors were left with less visibility into how the business worked.
Mindtree’s published figures provide direct evidence that a category boundary changed. The company reported digital services at 49.3% of revenue for the March 2019 quarter. In the following quarter’s fact sheet, after redefining the category as Interactive, Data Science and Engineering, Cloud Services and Others, it restated the same March quarter comparative figure to 37.0%. Mindtree disclosed the new definition and reporting methodology, but the materials reviewed for this article did not reconcile the 12.3-percentage-point difference.
Coforge provides a smaller example. On its July 2020 call, the company put digital at 40% of revenue, while the presentation reported 34%. An analyst asked which figure was correct. The answer was that 40% included both digital and IP revenue, with IP contributing 6%. The spoken script and the presentation had used different boundaries.
The point I am trying to make is that investors and analysts track all these metrics, some even maintained rigid excel sheets (including yours truly) over multiple quarters. We just somehow tried to shoehorn the numbers into a narrative that we could unveil to our end readers or consumers of research output.
You are going to see more of that in the coming quarters.
IV. What revenue per employee actually measures
In November 2025, Sanchit Vir Gogia of Greyhound Research wrote that revenue per employee is not a productivity metric but a legacy illusion. His point was about the denominator: subcontractors, platforms and automation carry a growing share of the work, and none of them appear in the headcount. A rising number can reflect delayed hiring and capability erosion rather than efficiency. In October 2025, Alten Capital observed that it could see no difference in revenue per employee attributable to generative AI, and noted that geography drives the metric.
Both critiques motivate what follows. I have not found a comparable company-by-company series covering the same period and measures.13
Using the same calculation at both endpoints (quarterly revenue multiplied by four, then divided by quarter-end headcount), Accenture’s annualised revenue per employee fell from approximately $111,500 in the November 2012 quarter to $91,800 in the February 2026 quarter. The decline was about 17.7% in nominal dollars and 42.0% after adjusting for US consumer-price inflation. Over the same period, Accenture’s headcount rose from about 2,59,000 to 7,86,432, slightly more than tripling.14
Over the same 13 odd years, Accenture’s gross margin went from 32.8% to 30.3%.
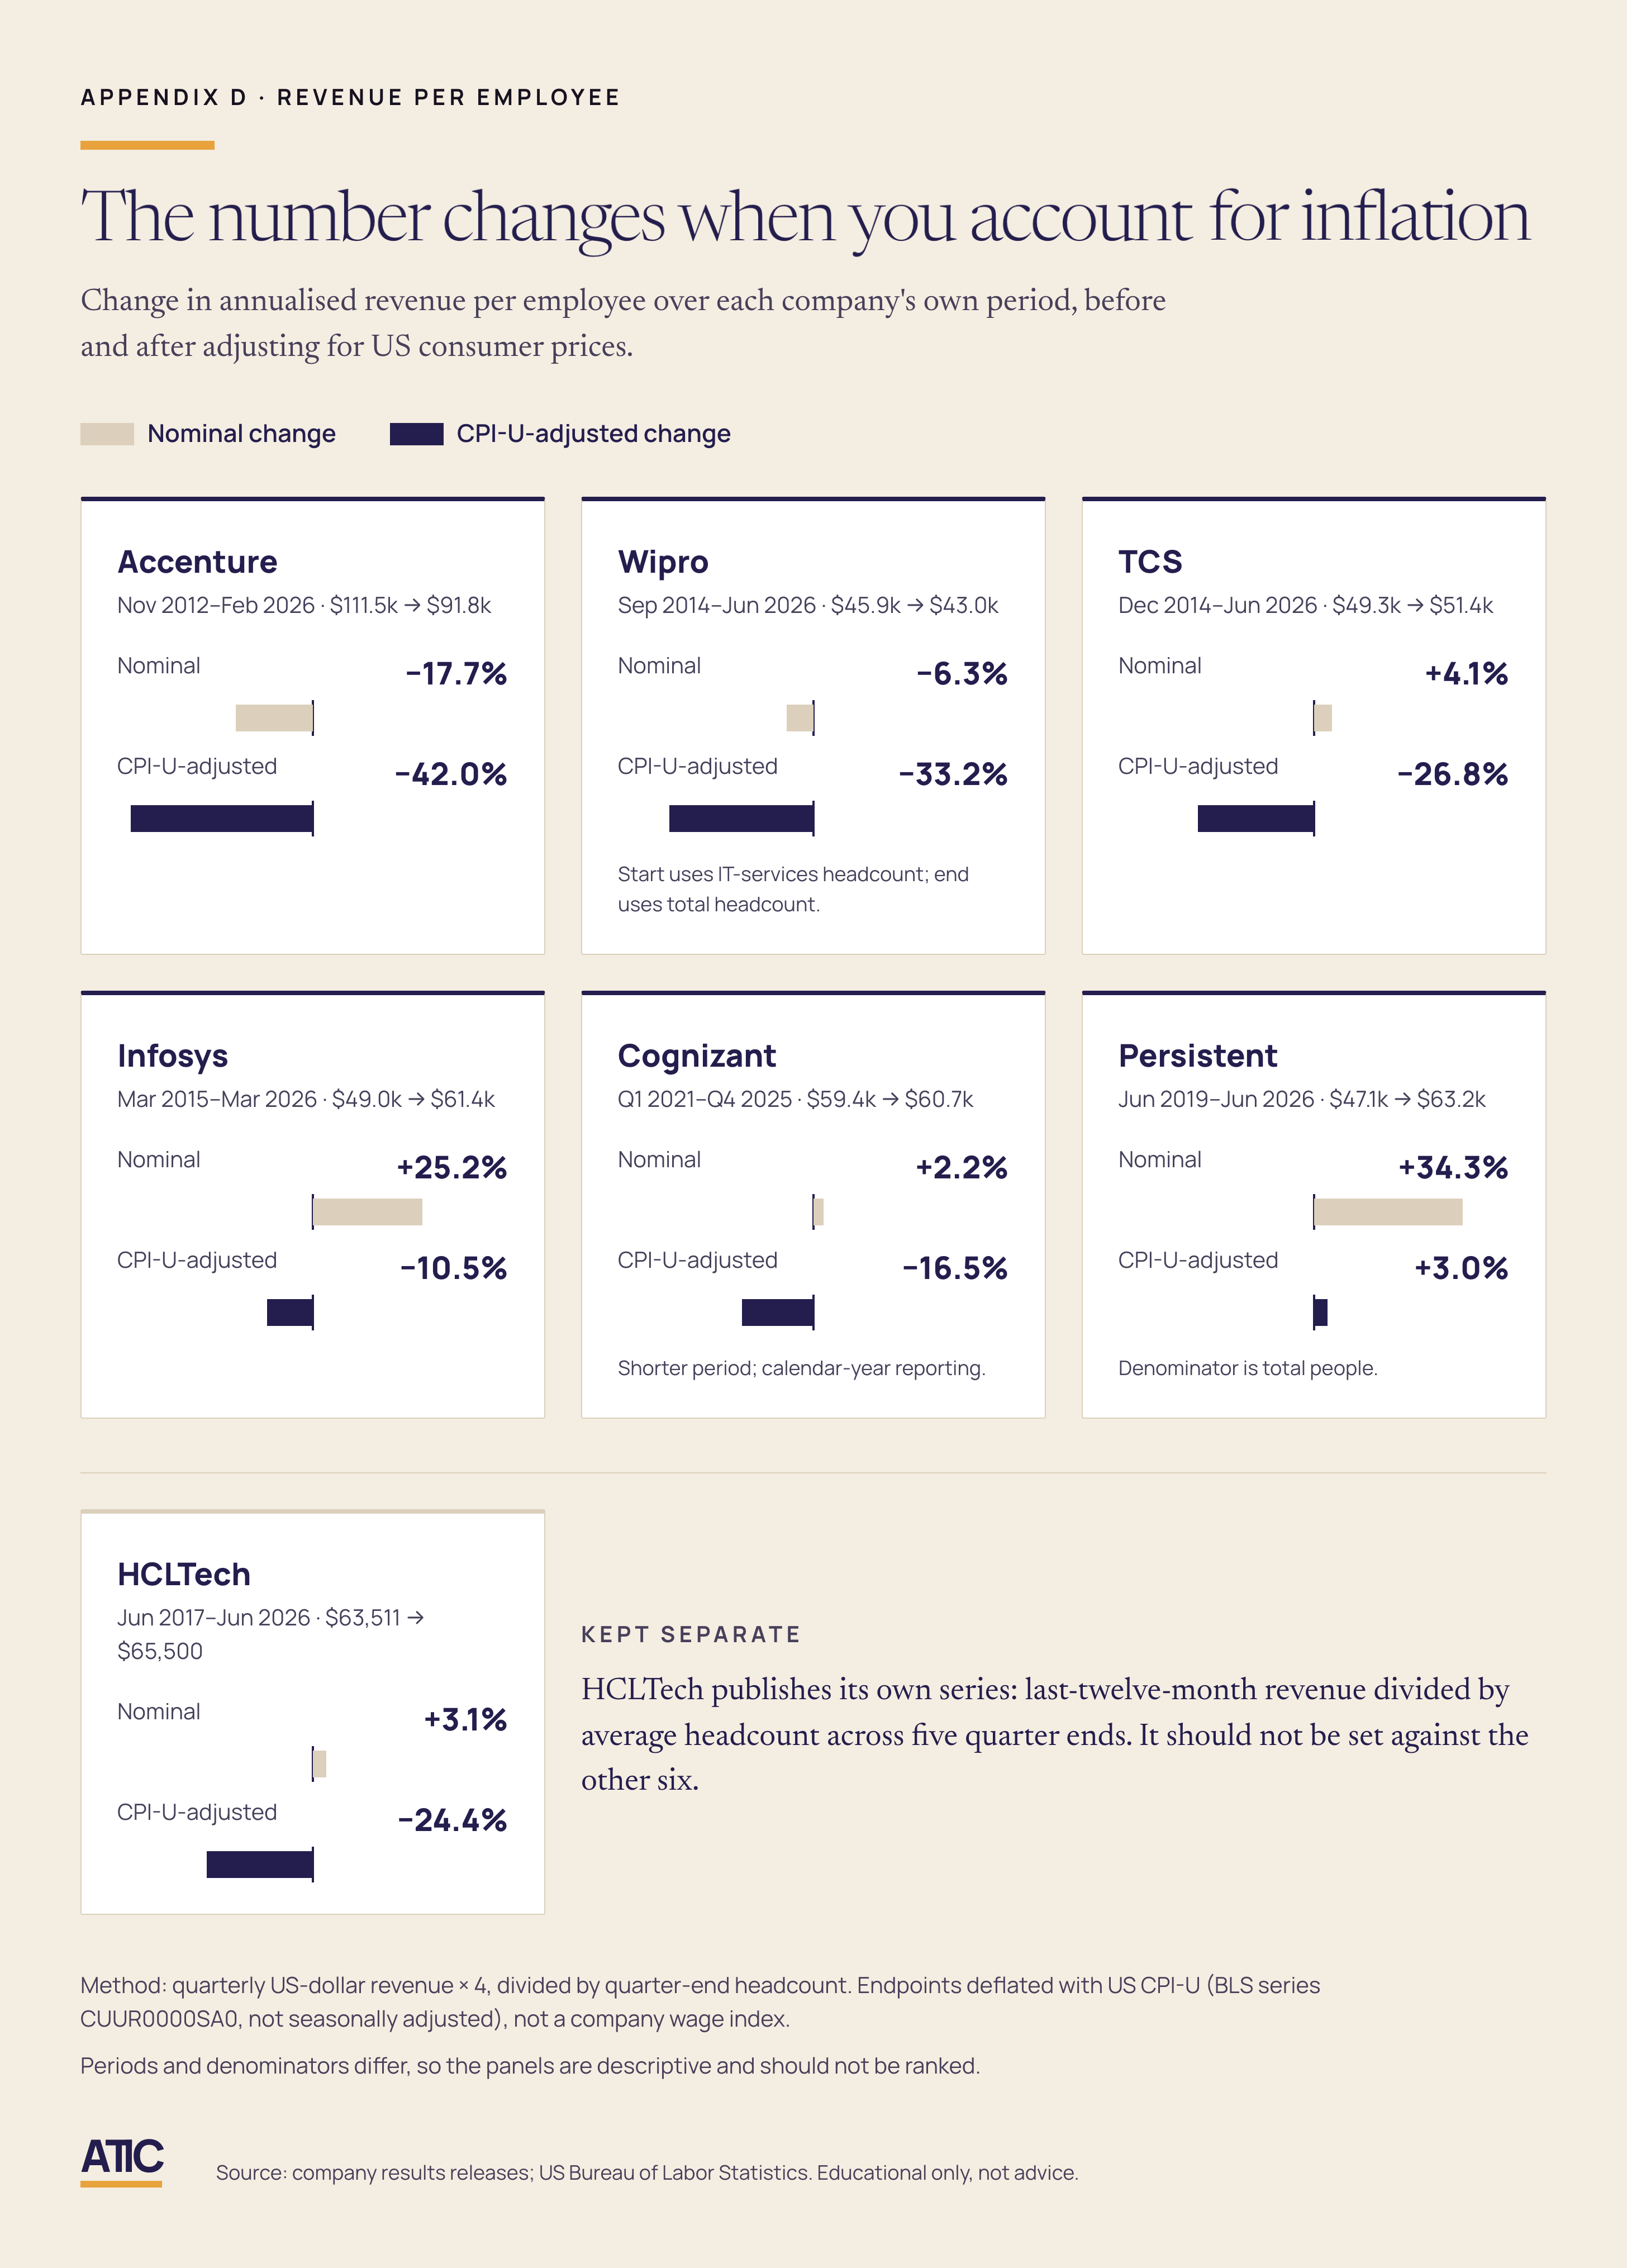
The two endpoints support a limited conclusion. In Q2 FY2026, Accenture generated about 42.0% less revenue per reported employee in real terms than it had in November 2012. Its gross margin was 2.5 percentage points lower. Over the same period, inflation-adjusted cost of services per reported employee fell by approximately 39.9%.
These figures are consistent with a shift towards lower-cost delivery, and Accenture’s presence in India makes labour geography a plausible mechanism. In September 2024, the company disclosed that its Advanced Technology Centres in India employed more than 2,20,000 people, representing over a quarter of its global workforce at the time.
One cannot separate that effect from acquisitions, foreign exchange, subcontracting, utilisation or changes in business mix. Also, one cannot safely say that Accenture replaced higher-cost workers with lower-cost ones or passed the savings to clients through lower prices.
Cognizant offers a useful comparison, although the data are insufficient for a control. Across the available data points, its inflation-adjusted revenue per employee fell by 16.5%, compared with about 42.0% at Accenture under the same broad convention. Differences in reporting periods, business mix and headcount definitions prevent the gap from being treated as a controlled test.15
The declines at two large, New York-listed IT services firms differed by about 25.5 percentage points. A gap that large makes it difficult to treat falling revenue per employee as an automatic consequence of the technology cycle.
Geography may explain part of the divergence. Cognizant entered the period with its delivery workforce already concentrated in India. Accenture’s 2,20,000 employees in its Indian delivery centres shows the scale of Accenture’s Indian operations. It does not show how many roles moved to India or how much of the gap geography explains.
The ratios point to different lines of inquiry at each company. At Accenture and Wipro, geography is relevant. At Infosys, utilisation rose from about 72% to an all-time high of 89.2% in the September 2021 quarter. At HCLTech and Persistent, business mix may matter. At Coforge, annualised revenue per employee fell by 29.8% in Q1 FY2022 as the acquisition of SLK Global added about 7,000 BPM employees. TCS had less room for a similar shift because it was already heavily offshore and reported utilisation of 86.7% in December 2014.
None of these observations clinches the causation argument. They show that geography, bench utilisation, business mix and acquisitions can move revenue per employee substantially without technology being the cause. Any attempt to attribute changes in the ratio to technology must first account for those mechanisms. That was the finding I did not expect when I began.
Accenture’s Advanced Technology Centres in India remain central to its offshore delivery model. The earlier death-knell argument treated that model as vulnerable, yet it continued to underpin a major Western competitor to Indian IT services companies.16
During the same period, several Indian firms whose workforces were already concentrated in India reported a shift away from time-and-materials contracts. Mindtree’s fixed-cost/fixed-monthly share rose from 33.2% to 67.1%. HCLTech’s corresponding category, later expanded to include managed services, increased from 44.0% to 68.4%. Infosys’s fixed-price share rose from 38.0% to 53.3% before the company stopped reporting the split. The three labels are not equivalent but together, they show a move towards non-T&M contracts, but they do not show a shift to outcome-based selling.
Contract mix alone reveals little about how the work was produced. Fixed-price contracts transfer estimation and delivery risk to the vendor, which can encourage automation, reuse and leaner staffing. A rising fixed-price share does not show whether any of those changes occurred.
HCLTech reported revenue per employee of $63,511 in June 2017. CEO C. Vijayakumar described the figure as industry-leading and 6% higher year-on-year. By June 2026, it had risen to $65,500. Under HCLTech’s convention, which divides revenue for the preceding 12 months by the average of five quarter-end headcounts, revenue per employee increased by 3.1% in nominal terms but fell by 24.4% after adjusting for US CPI-U. The comparison covers nine years.17
In a 22 December 2025 ET Now interview, Coforge chief executive Sudhir Singh said revenue per employee would remain an important measure of service-delivery quality and whether clients recognised the value being created. He also identified deal velocity and median deal size as leading indicators of future growth. These are management judgements, not validated relationships. They nevertheless show revenue per employee, the metric questioned throughout this section, being used in real time as evidence of value creation during the AI transition.18
V. Is this time really going to be different?
The analysis so far rests on the historical record: reported categories, revenue, margins and headcount. The observations are documented, although their interpretation remains open. This section moves from reconstruction to hypothesis.
Four developments may make the AI transition different from the cloud transition.
Platform companies are doing more implementation work
In July 2013, Chandrasekaran argued that TCS would gain from cloud because platform companies needed its implementation practice. That proved broadly right. Hyperscalers built professional services operations, but much of the implementation work continued to flow through partners, allowing Indian IT firms to earn revenue from the migration.
The balance is changing as platform companies expand their direct-delivery capacity. They can now keep more of the implementation work, putting pressure on the partner channel without eliminating it.
On 23 July 2026 during a post earnings call, an analyst asked Infosys’ Salil Parekh about AWS and Microsoft investing in their own delivery practices. The analyst found this more surprising than similar moves by model labs because hyperscalers had historically relied on the services channel for cloud implementation.
Parekh’s answer rested on scale and partnership. He contrasted Infosys’s 3,00,000 people with teams of a few hundred or a couple of thousand at software companies. He also noted that software companies had operated small services businesses before.
Parekh may be right about the difference in scale. Chandrasekaran’s confidence in 2013, however, rested on a clearer division of labour: platform vendors supplied the software, while partners handled much of the implementation. That division still exists, but it is becoming less distinct. The open question is how much implementation work will continue to flow through partners as platform companies build their own delivery capacity.
AI infrastructure divides the asset-light model
IT services has long been an asset-light business. Between November 2025 and September 2026, TCS and HCLTech committed capital to AI infrastructure.
TCS said HyperVault and its partners would invest up to ₹70,000 crore to build and manage a 1GW campus in Hyderabad for hyperscalers and frontier AI companies. TPG separately committed up to $1 billion to HyperVault. The plan takes TCS beyond implementing infrastructure for clients: HyperVault proposes to operate the capacity itself. HCLTech announced a smaller investment in July 2026, committing up to ₹3,500 crore to an AI data-centre business and describing a shift from “physical infrastructure to higher-value AI-ready solutions.” Its initial investment formed part of a long-term, 50MW full-stack model. That is a different scale of commitment from TCS’s proposed 1GW campus.19
Infosys, Wipro and Accenture chose less capital-intensive routes. Infosys said it would not enter the data-centre business. Wipro built an AI-infrastructure advisory practice, keeping its role on the services side. Accenture bought a data centre engineering consultancy, giving it the capability to advise hyperscalers on building their own facilities.
Among the companies and cloud-era disclosures reviewed for this blog, no capital commitment approached HyperVault’s scale. ICICI Securities estimated that the project could reduce TCS’s stabilised return on equity after five years from an estimated 50% in FY2026 to about 40%. The projection illustrates how materially an asset-heavy subsidiary could change the underlying business’ return metrics.
The initial market response to the combined earnings-and-strategy announcement was cautious. On 10 October 2025, the first trading day after the release, TCS fell 1.1% while the Nifty 50 rose 0.4%. Brokerage views diverged: Nuvama cut its target, while JM Financial, Motilal Oswal and Goldman Sachs raised theirs.20
Accenture’s response centred on organisational structure rather than physical assets. In September 2025, it combined Strategy, Consulting, Song, Technology and Operations into a single Reinvention Services business. In March 2026, it reorganised that business around seven client-facing Reinvention Partners, three capability-building Reinvention Engines and Client Success. The geographic markets remained intact. Accenture consolidated its service lines within the existing geographic structure rather than replacing the entire operating model.
The company later said employees seeking promotion were expected to use AI. Separately, a six-month business optimisation programme resulted in charges of $923 million. The changes therefore extended beyond adding another AI unit to the organisation chart. The reorganisation now presents a testable question: will Accenture’s economics change along with its structure? The answer will emerge on its own timeline.21
Savings-led transformation pressures existing revenue
The value proposition has kind of flipped. Management framed cloud-era digital as growth: TCS’ Chandrasekaran announced a Digital Consumer Economy, while Wipro’s Kurien described a completely new class of buyers.22
In its deal announcements for the June 2026 quarter, Mphasis described a Tier 1 US telecom engagement in terms of cost reduction, process automation and value realisation. An engagement with a top-tier investment bank was presented in similar language, with an emphasis on AI, automation, efficiency and measurable value. The framing aligns with what chief executive Nitin Rakesh has called Mphasis’s ‘Savings-led Transformation’ spiel.
During the same quarter, revenue grew by 8.3% year-on-year in constant currency, while gross margin fell by 200 basis points to 26.9%. The timing alone does not establish that the deal mix caused the margin decline.23
Cost-reduction work is funded partly by lowering a client’s run spend. That same run spend forms the annuity base of Indian IT services. At LTIMindtree, the pressure became visible in the September 2025 quarter, when the top five clients’ share of revenue fell from 27.3% to 25.3%. On the 16 October, during the post earnings call, CEO Venu Lambu said pressure from large customers had “more to do with AI” than with macroeconomic conditions. He described passing productivity gains to clients as a “transitionary phase” intended to help LTIMindtree win more work. The disclosures shows the sequence and record management’s explanation. They do not show that AI alone caused the change in revenue concentration.24
The familiar shock absorbers may be weakening
Across the companies that I have referred to in this blog, three levers recur in their responses to technological change. Geographic arbitrage moves work to lower-cost locations. Higher utilisation reduces the bench and puts existing staff to work more intensively. Changes in contract form allow vendors to accept more delivery risk in exchange for retaining a larger share of any efficiency gains. These are not the only available levers, but they are the three examined in this section.
None amounts, by itself, to what Hammer called obliteration. Offshoring, higher utilisation and different contract structures can reduce delivery costs without redesigning the underlying process. They can also accompany a genuine transformation, but they do not show that one occurred.
The tension is clearest in conventional effort-based contracts. A vendor may be rewarded for operating a client’s process more efficiently while receiving no reward for eliminating it. Outcome-based and gain-sharing contracts can change that incentive. Hammer’s 1990 diagnosis helps explain how to examine the industry’s model. It cannot establish that a single incentive governed the industry.
The familiar levers may now offer less room for further gains.
Utilisation measures are not directly comparable across companies. Under their respective definitions, Accenture reported 93% in its May 2026 quarter (Accenture's fiscal year runs from September 1 to August 31), while Infosys and LTIMindtree (now LTM) were running in the mid-80s in their latest reviewed quarters. Both were below earlier peaks: 89.2% at Infosys in September 2021 and 88.3% at LTIMindtree in June 2024. TCS had reported utilisation of 86.7% as early as December 2014.
Across the filings reviewed, fixed-price or managed-services shares ranged from roughly 50%-68%, although the measures and reporting dates differed. These figures do not talk about a hard ceiling. They indicate that further gains from geography, utilisation and contract form may be more difficult to extract.25
AI’s greater capability is only part of why this transition warrants closer attention. The familiar operating levers may have less room left, while the filings reviewed provide limited evidence of process redesign at scale. Companies still have options, but the next shock may be harder to absorb through geography, utilisation and contract form alone.26
That is not quite the argument the bears are making. Jefferies, after the February 2026 drawdown in Indian IT stocks, warned that application services account for 40%–70% of revenues and that consensus estimates do not reflect the erosion risk. That is a demand destruction argument. Mine is different: the industry’s established shock absorbers may be less effective than they were during the cloud transition. The two claims are separable, and the evidence will test them separately.27
A sharper version of the argument above comes from the deployment side itself. In a 5 September 2026 article posted on X titled “Applied AI Doesn’t Work,” Vasuman Moza, founder and chief executive of Varick Agents, argued that AI differs from cloud and digital because when it’s used to redesign rather than merely accelerate a process, a competitor can scale without a corresponding rise in processing headcount. His illustration: ask three analysts to double their output and the conventional response turns them into eight people once another team, a manager and the resulting handoffs are added. Output doubles. Headcount more than doubles. Revenue per employee falls. The example does not independently validate this piece’s findings, but it reaches the same underlying tension from the perspective of someone who sells and deploys the technology.28
Moza’s account supports the difficulty of redesign. It does not illustrate how often organisations succeed. The government evidence below addresses a narrower question: whether reported time savings translated into measurable productivity in one Copilot pilot.
Three months before Moza’s Twitter article, Cognizant CEO Ravi Kumar expressed a related scepticism from the incumbent IT services side, describing heavy token consumption as “a vanity metric”. Their arguments were not identical: Kumar questioned measures of AI activity, while Moza argued that deploying AI without redesigning the process produces little organisational value. Their common ground is narrower but meaningful: deployment alone is not an outcome.29
AI adoption has yet to create its economic payoff
Moza’s argument borrows from the UK’s Department for Business and Trade’s pilot project where it allocated 1,000 Microsoft 365 Copilot licences for three months. About 70% went to volunteers and 30% to a stratified random sample intended to improve representativeness. The evaluation lacked a counterfactual and could not establish causal productivity gains. Supplementary tests involving only three users and three non-users found faster but lower-quality PowerPoint work, and slower, less accurate Excel work. More broadly, the evaluation found no robust evidence that reported time savings translated into improved productivity. Yet 72% of participants were satisfied or very satisfied.30
McKinsey’s August 2026 annual survey of enterprise AI, drawing on 1,719 respondents. 80% said AI had improved their individual productivity. 37% said AI had contributed positively to their organisation’s EBIT, essentially unchanged from a year earlier. The share of high performers, defined as those attributing at least 5% of EBIT to AI, was flat at about 6%.31
On employment, 14% of respondents at organisations using AI said it had contributed to a decline in workforce size over the previous year. In the preceding survey, 32% had expected such a decline. McKinsey repeated the comparison among the 552 people who completed both surveys and found the same pattern. Expectations remain higher than reported outcomes: 39% now anticipate workforce reductions over the coming year.
That is the distinction this piece is tracing on the vendor side: task-level efficiency is not automatically firm-level productivity. TCS says AI-derived productivity is beginning to enter contract renewals, but it has not quantified those gains. At the same time, HCLTech chief executive C Vijayakumar has modelled potential AI-related revenue deflation of 2%–3% a year. Cognizant CEO Ravi Kumar has cited research estimating that 93% of US jobs have at least some task exposure to AI, while arguing that tasks are more likely to change than entire jobs are to disappear. The figures cannot be compared: one estimates revenue deflation and the other task exposure. Neither is an observed outcome. Their coexistence shows how unsettled the industry’s account of AI’s economic effect remains.32
Public reassurance has not always sat comfortably with what followed. In March 2026, Tech Mahindra’s CEO told Fortune that productivity gains would not produce immediate headcount effects. Four months later, the company explained a 7% year-on-year decline in IT-services headcount partly through productivity in fixed-price work using new AI tools, alongside redeployment and reduced backfilling. The two statements are not logically inconsistent: gradual pressure through attrition and redeployment is not an immediate jobs apocalypse. But the sequence shows how quickly a general reassurance can acquire qualifications when the operating data arrive.33
Nearly four years after ChatGPT’s November 2022 release, the evidence I have tried to examine offers no common account of AI’s economic effect. Vendors cite task-level productivity, executives model revenue deflation or job exposure, and a government pilot found no robust evidence that reported time savings improved productivity. The measures are not directly comparable and sometimes sit uneasily beside earlier assurances. That absence of a common denominator is itself a finding. Across these examples, AI remains less a settled economic outcome and more a future advantage waiting to be realised.
McKinsey reads the same gap differently in its 2026 survey. The consulting firm found that respondents at high-performing organisations were more likely to report redesigning workflows rather than inserting AI into existing ones. It interprets that association as evidence that the constraint is organisational. But the survey is weighted, self-reported and cross-sectional. It does not conclude that redesign caused the reported financial performance or that returns will necessarily follow. The next few years will test whether redesign converts adoption into measurable firm-level gains.34
CLSA’s 18 August 2026 note models AI revenue reaching 33% of TCS revenue and 32% of Infosys revenue by FY2031. Both sit within the roughly 27–44% range at which several digital-era metrics examined in Part III were withdrawn while still growing. This does not predict that CLSA’s forecasts will fail. It identifies a second testable outcome: whether these AI-revenue metrics disappear before reaching CLSA’s targets, as several predecessors did.35
The next time an IT services company’s management speaks after an earnings release, investors and analysts should ask what its chosen measures reveal, what they leave out, and whether they show a change in the economics of the business. Fifteen years of disclosures offer a way to distinguish a changing narrative from a changing business.
Tracking IT services companies helped me develop this lens. Now it’s yours to keep.
Michael Hammer, ‘Reengineering Work: Don’t Automate, Obliterate,’ Harvard Business Review, July–August 1990. https://hbr.org/1990/07/reengineering-work-dont-automate-obliterate
Michael Hammer and James Champy, Reengineering the Corporation (HarperBusiness, 1993). The authors characterised the 50–70% estimate as unscientific; it should not be read as a measured population failure rate.
Forrester, ‘Is This The End Of India’s IT Services Success Story?,’ February 2012. https://www.forrester.com/blogs/is-this-the-end-of-indias-it-services-success-story
Forrester, ‘Whither Indian IT?,’ July 2017. https://www.forrester.com/blogs/17-07-07-whither_indian_it
NASSCOM, Technology Sector in India: Strategic Review 2026. https://nasscom.in/knowledge-center/publications/technology-sector-india-strategic-review-2026. Earlier employment and revenue endpoints are from the historical industry series assembled for this article; coverage is not necessarily like-for-like.
Wipro Q4 FY2016 earnings call, 20 April 2016. https://seekingalpha.com/article/3966758-wipro-ltds-wit-ceo-abidali-neemuchwala-on-q4-2016-results-earnings-call-transcript
TCS Q2 FY2015 earnings call, 16 October 2014, transcript in the author’s original research archive. The supplied TCS corpus begins at Q3 FY2015.
TCS Q3 FY2014 earnings call, 16 January 2014: https://www.tcs.com/content/dam/tcs/investor-relations/financial-statements/2013-14/q3/Management%20Commentary/Transcript%20of%20the%20Q3%202013-14%20Earnings%20Conference%20Call%20held%20at%2019%2000%20hrs%20IST%20on%20Jan%2016%2C%202014.pdf. Tech Mahindra Q1 FY2027 earnings-call transcript, 16 July 2026: https://insights.techmahindra.com/investors/tml-q1-fy-27-earnings-transcript.pdf
TCS and Infosys quarterly results, Q1 FY2016–Q1 FY2027 and Q1 FY2013–Q1 FY2027 respectively. Counts are inclusive of the first and final quarterly disclosures.
Wipro, Tech Mahindra, LTI/LTIMindtree and Coforge/NIIT Technologies quarterly results. Historical names and fiscal-quarter labels are retained as published.
HCLTech and Mphasis quarterly results. Mphasis’s 78% and 84% figures were deal-win shares; the revenue series began at 44.4% of Direct Core revenue in Q1 FY2019.
Cognizant, Accenture and Persistent Systems results. Cognizant’s 2022 definition change restated 2021 digital shares to 46%, 47%, 49% and 49%; subsequent reviewed results no longer carried the measure.
Sanchit Vir Gogia, Greyhound Research / NDTV Profit, ‘Revenue Per Employee Isn’t Productivity. It’s A Legacy Illusion,’ 19 November 2025: https://www.ndtvprofit.com/opinion/the-big-misread-revenue-per-employee-isnt-productivity-its-a-legacy-illusion. ALTEN Capital, ‘Revenue per Employee in Technology Services,’ 2 October 2025: https://alten.capital/blog/revenue-per-employee-in-technology-services
Accenture Q2 FY2026 earnings presentation: https://investor.accenture.com/~/media/Files/A/accenture-v4/investors/earnings-reports/2026/second-quarter-fiscal-2026-earnings-presentation.pdf; SEC earnings exhibit: https://www.sec.gov/Archives/edgar/data/1467373/000146737326000013/q2fy26earnings8-kexhibit.htm. Formula: quarterly USD revenue ×4 ÷ quarter-end headcount. Real change uses US CPI-U, not seasonally adjusted, series CUUR0000SA0: https://download.bls.gov/pub/time.series/cu/cu.data.1.AllItems
Cognizant quarterly filings; the calculation uses the same broad annualised-quarterly-revenue / reported-headcount convention and CPI-U series as the Accenture comparison. Differing periods and definitions preclude treating Cognizant as a control.
Accenture Q4 FY2024 earnings call, 26 September 2024, in the supplied Accenture corpus. The company said its Advanced Technology Centers in India had more than 2,20,000 people; no later company disclosure of that specific India figure was located in the reviewed materials.
HCLTech quarterly results corpus supplied for this article. HCLTech’s disclosed RPE convention is last-twelve-month revenue divided by average headcount across five quarter ends. Real change uses CPI-U series CUUR0000SA0: https://download.bls.gov/pub/time.series/cu/cu.data.1.AllItems
ET Now, interview with Coforge CEO Sudhir Singh, 22 December 2025. https://www.etnownews.com/markets/exclusive-ai-is-a-massive-tailwind-not-deflationary-coforge-ceo-sudhir-singh-on-why-business-led-ai-solutions-are-driving-growth-video-interview-article-153331308
TCS HyperVault announcement: https://www.tcs.com/who-we-are/newsroom/press-release/tcs-hypervault-establish-large-scale-ai-data-center-campus-telangana. TPG commitment: https://www.tpg.com/news-and-insights/tcs-secures-1bn-investment-from-tpg-to-accelerate-ai-data-center-business-hypervault. HCLTech announcement: https://www.hcltech.com/press-releases/hcltech-launches-full-stack-ai-offering-powered-new-ai-data-center-investment
ICICI Securities report: https://smartbrokercrmportal.icicidirect.com/ResearchDownload.aspx?Cid=F3vHkDafc7k%3D&Pid=Yixoj%2Fxl2%2B4%3D&fname=XgTiMuHCRIZ75Cb2h17XnzuSySi91pt3&typ=APSSeVhmQ%2B8%3D. Brokerage actions: Nuvama — https://www.moneycontrol.com/news/business/earnings/tcs-q2-show-in-line-while-street-unclear-on-data-centre-push-should-you-buy-sell-or-hold-13608140.html; JM Financial — https://www.businesstoday.in/markets/stocks/story/jm-financial-bullish-on-tcs-post-q2-results-sees-15-upside-heres-why-497630-2025-10-10; Motilal Oswal and Goldman Sachs — https://www.etnownews.com/markets/tcs-share-price-target-should-you-buy-tata-stock-after-q2-results-know-what-brokerages-recommend-article-152974337
Reuters, Accenture’s restructuring programme, 25 September 2025: https://www.reuters.com/business/accenture-posts-fourth-quarter-revenue-above-estimates-2025-09-25/.
TCS and Wipro historical earnings-call transcripts in the author’s source corpus. ‘Digital Consumer Economy’ and the description of a new class of buyers are management characterisations, not independently measured budget categories.
Mphasis Q1 FY2027 earnings filings; Mphasis, ‘AI won’t kill tech services, it will reset them,’ 17 February 2026: https://www.mphasis.com/home/corporate/news/ai-wont-kill-tech-services-it-will-reset-them-mphasis-ceo-nitin-rakesh.assetType.null.html
LTIMindtree September 2025 results and 16 October call in the supplied LTI/LTIMindtree corpus; Reuters, 27 October 2025: https://www.reuters.com/world/india/indias-ltimindtree-betting-big-new-ai-unit-ceo-says-2025-10-27/
Accenture, Infosys, LTIMindtree and TCS company results. Accenture reported 93% utilisation in the quarter ended May 2026; the 89.2% Infosys and 88.3% LTIMindtree figures are historical peaks from September 2021 and June 2024. Definitions differ by company and trainee/billable-employee treatment; these figures are contextual, not a common benchmark.
Scope note: this conclusion is limited to the eleven present-day corporate lineages and public disclosures reviewed for the article. It is not a census of redesign activity across the industry.
Reuters, analyst concerns over Indian IT services, including Jefferies’ 40–70% application-services exposure estimate, 5 February 2026. https://www.reuters.com/world/india/anthropics-ai-push-raises-analyst-concerns-over-it-services-revenues-2026-02-05/
Vasuman Moza, ‘Applied AI Doesn’t Work,’ article posted on X, 5 September 2026. The argument is attributed to the author and is not treated as independent empirical validation.
Fortune, interview with Cognizant CEO Ravi Kumar, 1 June 2026. https://fortune.com/2026/06/01/cognizant-ceo-ravi-kumar-ai-tokenmaxxing-vanity-metric-hiring-graduates/
UK Department for Business and Trade, Evaluation of the M365 Copilot Pilot, August 2025. https://assets.publishing.service.gov.uk/media/68adbe409e1cebdd2c96a19d/dbt-microsoft-365-copilot-evaluation.pdf
McKinsey, ‘The state of AI,’ 25 August 2026. https://www.mckinsey.com/capabilities/quantumblack/our-insights/the-state-of-ai. Survey results are weighted, self-reported and cross-sectional.
TCS earnings call transcripts; Moneycontrol interview with HCLTech CEO C. Vijayakumar, 21 April 2026: https://www.moneycontrol.com/artificial-intelligence/hcltech-flags-2-3-ai-deflation-bets-on-new-ai-services-to-offset-hit-article-13895520.html; Cognizant exposure report: https://www.cognizant.com/us/en/aem-i/ai-and-the-future-of-work-report; denominator explanation: https://www.cognizant.com/us/en/insights/insights-blog/ai-job-exposure-and-human-labor
Fortune, Tech Mahindra CEO Mohit Joshi interview, 19 March 2026: https://fortune.com/2026/03/19/tech-mahindra-ceo-mohit-joshi-ai-jobs-apocalypse-headcount/. Tech Mahindra Q1 FY2027 transcript, 16 July 2026: https://insights.techmahindra.com/investors/tml-q1-fy-27-earnings-transcript.pdf
McKinsey, ‘The state of AI,’ 25 August 2026. https://www.mckinsey.com/capabilities/quantumblack/our-insights/the-state-of-ai. The workflow-redesign result is an association in a weighted, self-reported survey, not a causal estimate.
CLSA India, “India IT — Sector outlook: Still amid storm but with anchors,” Sumeet Jain and Mridul Goenka, 18 August 2026.